
Azure Application Insights – Easy Guide to Monitoring
Azure Application Insights is a tool that helps you watch how your apps are doing. It shows performance, user activity, and errors in real time. This makes it simple to keep apps healthy and fix problems early. In this guide, you will learn what it is, why to use it, and the step-by-step setup process with all required options.
What is Azure Application Insights?
Application Insights is part of Azure Monitor. It is an Application Performance Management (APM) service. It helps developers and DevOps teams by:
- Tracking performance in real time
- Studying user behavior and usage patterns
- Detecting and solving issues fast
- Supporting decisions with real data
It works with web, mobile, desktop, and IoT apps, both in the cloud and on-premises.
Why Use Application Insights?
Some strong reasons to use it are:
- Real-time performance check – See response time, errors, and app dependencies as they happen
- User behavior analysis – Track page views, clicks, and flows
- Alerts – Get alerts for unusual activity or performance issues
- DevOps integration – Connects with Azure DevOps for faster bug fixing
How to Set Up Azure Application Insights
Step 1: Create an Application Insights Resource
- Log in to the Azure Portal
- Click Create a resource (on the left menu)
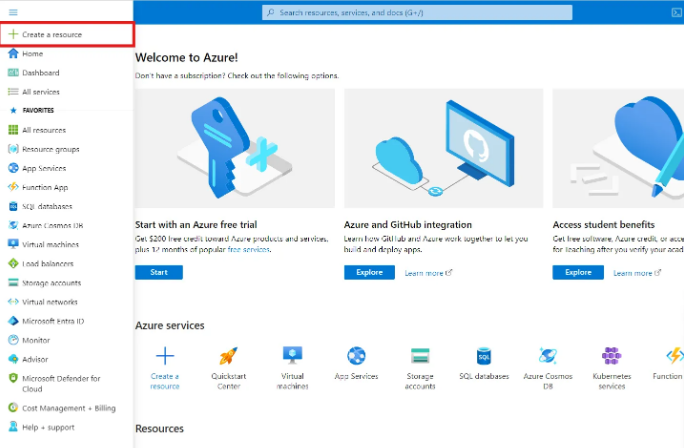
- In the search bar, type Application Insights, then select it

- Click Create and fill in the details:
- Subscription – Choose the billing account
- Resource Group – Select an existing group or create a new one
- Name – Enter a unique and clear name
- Region – Pick the geographic location you prefer
- Type of Application – Select what you are monitoring (Web, Mobile, etc.)
- Subscription – Choose the billing account
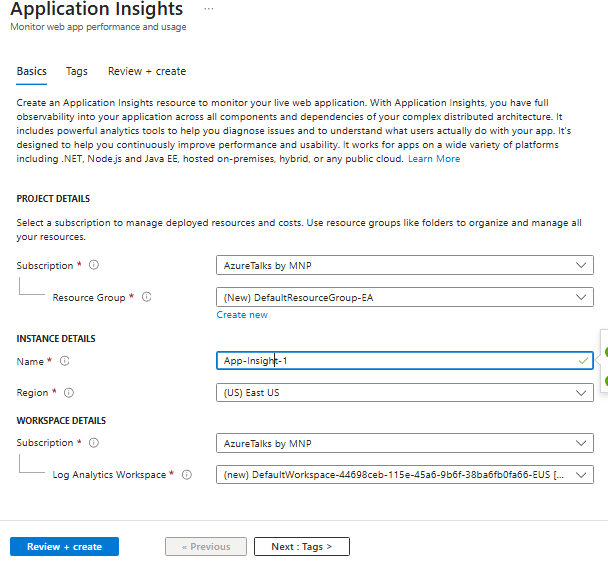
- Click Review + Create, then click Create

Step 2: Get the Connection String
- After deployment, go to your Application Insights resource

- On the Overview tab, copy the Connection String

Step 3: Add the SDK to Your Application
1) Install SDK
Install the SDK in Your Application: Depending on your application’s technology stack, install the appropriate Application Insights SDK.
For example:
- .NET / .NET Core – Install Microsoft.ApplicationInsights.AspNetCore from NuGet
- Java – Add applicationinsights-core in pom.xml or build.gradle
- Node.js – Run npm install applicationinsights
- Python – Use opencensus-ext-azure
- JavaScript (Browser) – Add the Application Insights JavaScript snippet
- Ruby – Install application_insights gem
2) Initialize the SDK with your Connection String
In your app’s startup file, you tell the SDK:
“Here is my Connection String. Send all telemetry to this Azure resource.”
Example for Node.js:
const appInsights = require(‘applicationinsights’);
appInsights.setup(‘YOUR_CONNECTION_STRING’)
.setAutoCollectConsole(true, true)
.setAutoCollectExceptions(true)
.setAutoCollectRequests(true)
.start();
This code:
- Turns on console logging capture
- Collects exceptions (errors)
- Tracks all requests automatically
3. Use the SDK to track custom events (optional)
You can log your own events in addition to the automatic ones. For example, when a user signs in or buys something, you can send a custom event:
client.trackEvent({ name: “User Signed In” });
4. Data flows to Azure
Once the SDK is added and running, your app automatically sends data (requests, errors, user activity, performance) to Azure Application Insights, where you can see it in dashboards, charts, and logs. Here is how mine is showing:

Step 4: Configure Data Collection and Sampling
- Go to your Application Insights resource in the portal
- Click Configure → Usage and Estimated Costs
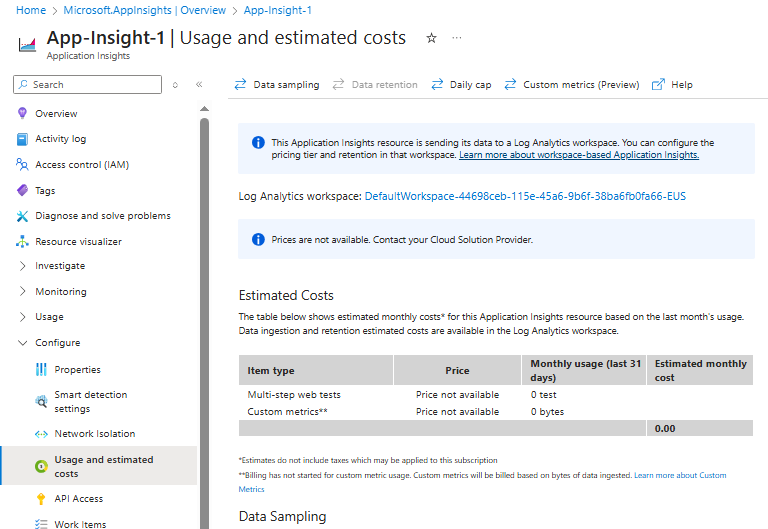
- Choose Data Sampling to manage how much data is collected

- Lower sampling → More detailed data but higher cost
- Higher sampling → Less detail but lower cost
- Under Monitoring → Diagnostic settings, click Add diagnostic setting
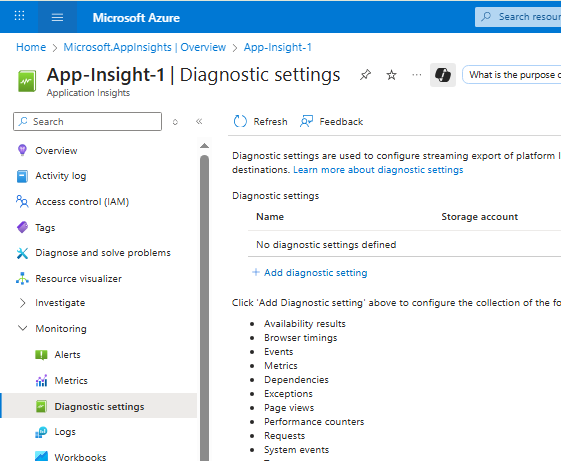
- Select what to collect:
- Requests
- Exceptions
- Traces
- Custom events
- Metrics
- (or check allLogs to collect everything)
- Requests

- Save your settings
Supported Languages and Platforms
Application Insights works with:
- .NET and .NET Core
- Java
- Node.js
- Python
- JavaScript (browser apps)
- Ruby
It supports cloud and on-premises apps, across web, mobile, and desktop.
For ASP.NET Core, you can add the SDK into Startup.cs using dependency injection, and it will track requests, dependencies, and exceptions automatically.
Extra Information for Metrics to Monitor
Server-side Telemetry
- Response Times – Check request speed
- Failure Rates – See failed requests
- Dependencies – Watch external services and databases
Client-side Telemetry
- Page Views – How many times pages are visited
- Load Times – Speed of page loading
- User Interactions – Actions like clicks, form submits, navigation
Custom Events and Metrics
- Track user sign-ups, purchases, or features used
- Add custom business numbers like revenue, conversions, or retention
Performance Counters and Resource Use
- CPU Usage – Monitor processor load
- Memory Usage – Find leaks or high use
- Disk I/O – Watch read/write activity
Troubleshooting with Application Insights
- Analyze logs and traces – Use Logs to query data and find errors
- Check performance bottlenecks – Use Performance blade to see end-to-end transactions
- Debug failures – The Failures blade shows exceptions with stack traces
- Track across services – Use Correlation IDs to follow requests between services
Conclusion
Azure Application Insights is a complete solution for monitoring apps. It helps you track performance, fix problems fast, and understand user activity. By setting it up step by step, adding the SDK, and configuring data collection, you can keep your applications healthy and reliable.
![]()